Top Five Cities to Open a Pet Franchise
Where to Open a Pet Franchise
The business world is expanding. New York City and Los Angeles are not the only places to begin to go to business school, begin a startup, or open a pet franchise shop. Splash and Dash Groomerie & Boutique has been keeping their eyes on gold mine cities. The key is to find a city that is both experiencing rapid economic growth where pet lovers also live. Business professionals who love their Dobermans living in a thriving metropolis is what you should be looking for.
According to an American Pet Products Association survey, a record 65%, or 79.7 million, American households today own a dog. The number is also rising.
The August edition of Entrepreneur magazine released it’s list of The Best 50 Cities for Entrepreneurs. They teamed up with Livability and compiled a list based on entrepreneurial growth. Many of the cities also made another list. Wallethub compiles an annual list of 2016’s Most Pet-Friendly Cities.
Splash and Dash Groomerie & Boutique compared the two and made our own list. The top five best places to open a pet franchise. We based this list off a comparison between cities that are emerging silicon valleys, and places where pets can enjoy the best quality of life.
5 Seattle, Washington
- Population: 637,850
- Dog Parks: 33
- Seattle University’s Albers School of Business and Economics
- Business Growth Rate (2011-2015): 10%
- Employment Growth (2011-2015): 9%
Just thinking of Seattle makes one taste the flavor of Starbucks. This city has become the mecca of coffee franchises like Tully’s Coffee and Espresso Vivace, but it also noteworthy for it’s pet-friendliness. According to the Seattle Times individuals with dogs spend averagely $752.20 a year on their pets.
4 Lincoln, Nebraska
- Population: 265,811
- Dog Parks: 2, 10 dog friendly attractions within driving distance of the city.
- University Of Nebraska-Lincoln’s, College of Business Administration
- Business Growth (2011-2015): 15%
- Employment Growth (2011-2015): 14%
Nebraska is a prairie state where many families own dogs to roam the expansive Midwest lands. Lincoln is also home to University of Nebraska’s Center for Entrepreneurship. The city was also ranked in the Top 10 Best College Towns. The city also features a variety of assets for entrepreneurs like the Center for Rural Entrepreneurship and Southeast Community College Entrepreneurship Center.
3. Portland, Oregon
- Population: 602,568
- Dog Parks:36
- Portland State University of Business Administration
- Business Growth (2011-2015): 14%
- Employment Growth (2011-2015):5%
Portland is home to divisions of Microsoft, Intel, eBay, and IBM to name a few recognizable names. The city has so many tech startups that is becoming another silicon valley. Business breeds business. Companies need third party supplies and logistic services. Portland also has a high number of citizens investing in their pets with high scores on their pet budget ranking. This progressive city is a fan of adopting business and “weird” trends.
2. Austin, Texas
- Population:885,400
- Dog Parks: 15
- University of Texas McCambs Business School
- Business Growth (2011-2015): 17%
- Employment Growth (2011-2015): 3%
Big names like 3M, Apple, and Google all have a home in Austin. But the initial “small-guy” startup ups like Legalzoom and Indeed also began in the “Live Music Capital of the World.” Austin’s residents also love their dogs. According to their local paper, Statesman, Austin has over 7.2 million dogs. Austin alone counts for 9% of dogs owned in America, and is the 11th most populated city.
-
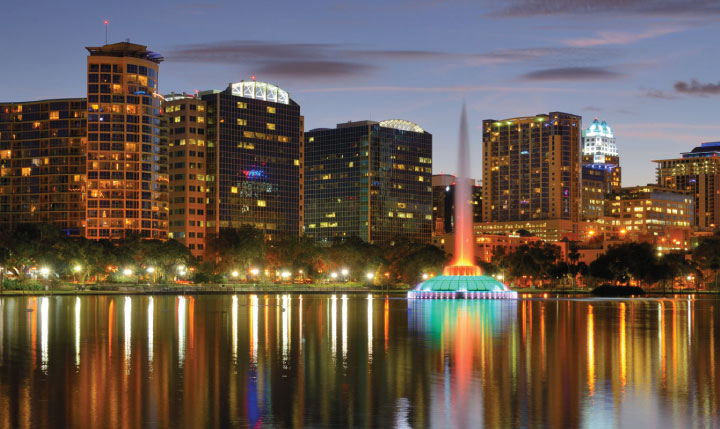
Orlando, Florida
- Population: 250,224
- Dog Parks:9
- University of Central Florida
- Business Growth (2011-2015):17%
- Employment Growth (2011-2015):3%
This city is Splash and Dash Groomerie & Boutique’s number one because it is number one it pets. Followed by an equally impressive number 15 in Business. This is strategic for those entering the pet franchise. Orlando is a city that has just begun it’s economical spike and will continue to grow. The home of the Orlando Magic ranks highest in pet budget rank, health and wellness, and outdoor pet friendliness. The Orlando Business Journal reports that 71% of residents buy their dog a gift with an averaging cost of $25. This hints that Orlando’s residents are pet lovers.
The City also hosts UCF’s Center for Entrepreneurial Leadership. Located in their Fashion Square is National Entrepreneurship Center. Other economical assistance are 1 Million Cups Orlando, IQ Orlando, and Backstage Launchpad, just to name a few.
Where the Pet Numbers Came from
The American Pet Products Association (APPA) 2016 Survey recorded the 100 largest cities based on 19 key metrics. The three categories measured were Pet Budget, Pet Health and Wellness, and Outdoor Pet Friendliness.
Pet Budget
- Veterinary Care Costs
- Minimum Pet-Care Provider Rate per Visit
- Dog-Insurance Premium
Pet Health & Wellness
- Veterinarians per Capita
- Pet Caretakers per Capita
- Number of Pet Businesses per Capita
- Pet-Friendliness of Rental Market: Full Weight Pet-Friendly Restaurants per Capita
- Pet-Friendly Hotels
- Number of Pet Meetup Groups per Capita
- Average Home Square Footage
- Family Detached Households
- Occupied Housing Units with One or Fewer Occupants per Room
- Animal Shelters per Capita
Outdoor Pet-Friendliness
- WalletHub “Weather” Ranking
- Number of Dog Parks per Capita
- Walk Score
- Pet-Friendly Trails per Capita
- Dog Shows per Capita
Where the Business Numbers Came From
Livability surveyed census numbers paired with key metrics to compiled from 22,000 cities. Trend analyst Matt Carmichael spearheaded the project based on these economic indicators:
- Number of Business and Employees
- Unemployment Rate
- VC Deals in Last Ten Years
- startups/Growth Equity Capital/Loan Capital
- Business Tax Rate
- Value of Small Business Administration and 7(a) loans
- Business Tax Rate
- Percent of Educated Professionals
- Cost of Living
- Commute Time
- Accessibility to high-speed broadband
- Projected Household Income
- Population Increase between 2014 t00 projections to 2020.
- “Leakage/Surplus”
- Money Spent within the city limits or outside city limits

